
Nifty 50 Index Replacements: Trends, Returns & Sectoral Shifts (2017–2025)
During the dynamic phase of the Indian stock market, the benchmark Nifty 50 index sees periodic adjustments in its constituent stocks by replacing fewer representative stocks with superior performing market leaders. This exercise has been frequently referred to as Index Rebalancing or Rejig. These rebalances have provided insightful observations on Indian stock market trends, sector rotation patterns and prospective investment avenues when strategized.
This article examines Nifty 50 rebalanced stocks of the year 2017 to 2025 to determine trends that give insights regarding investment options and strategies.
Comparative Analysis of Nifty 50 Inclusions and Exclusions with One-Year Returns (2017-2025)
Nifty 50 Exclusions
|
Date of Replacement |
Former Constituent
|
Former Constituent |
||
|
Price on Replacement Date |
Price Next Year |
% Return |
||
|
31-Mar-17 |
BHEL |
108.55 |
82.45 |
-24.04% |
|
Idea Cellular |
51.85 |
47 |
-9.35% |
|
|
26-May-17 |
Grasim Industries |
907.7 |
1060.3 |
16.81% |
|
29-Sep-17 |
ACC |
1656.9 |
1573.6 |
-5.03% |
|
Bank of Baroda |
137.5 |
104.5 |
-24.00% |
|
|
Tata Power |
77.8 |
67.95 |
-12.66% |
|
|
02-Apr-18 |
Ambuja Cements |
240.2 |
229.95 |
-4.27% |
|
Aurobindo Pharma |
592.55 |
786.25 |
32.69% |
|
|
Bosch India |
18515 |
17946 |
-3.07% |
|
|
28-Sep-18 |
Lupin |
900.95 |
717.25 |
-20.39% |
|
29-Mar-19 |
Hindustan Petroleum |
283.85 |
170.25 |
-40.02% |
|
27-Sep-19 |
Indiabulls Housing Finance |
390.1 |
155.2 |
-60.22% |
|
19-Mar-20 |
Yes Bank |
53.5 |
14.95 |
-72.06% |
|
31-Jul-20 |
Vedanta |
113.8 |
301.85 |
165.25% |
|
25-Sep-20 |
Zee Entertainment |
198.2 |
322.25 |
62.59% |
|
Bharti Infratel |
182.9 |
* |
* |
|
|
31-Mar-21 |
GAIL |
90.25 |
103.55 |
14.74% |
|
31-Mar-22 |
Indian Oil Corp |
79.3 |
77.9 |
-1.77% |
|
30-Sep-22 |
Shree Cement |
21033.1 |
24261 |
15.35% |
|
13-Jul-23 |
LTIMindtree |
5,319.20 |
5,340.65 |
0.40% |
|
07-Sep-23 |
Jio Financial Services |
213.25 |
278.1 |
30.41% |
|
30-Sep-23 |
Trent Ltd |
2,239.90 |
3,200.50 |
42.89% |
|
Bharat Electronics Ltd (BEL) |
132.25 |
145.7 |
10.17% |
|
|
28-Mar-24 |
UPL Ltd.? |
495.5 |
540 |
8.98% |
|
30-Sep-24 |
Divi's Laboratories Ltd |
5457.5 |
* |
* |
|
LTIMindtree Ltd |
6234.45 |
* |
* |
|
|
28-Mar-25 |
Bharat Petroleum Corporation Ltd. (BPCL) |
165 |
* |
* |
|
Britannia Industries Ltd. |
7861.95 |
* |
* |
|
Nifty 50 Inclusions
|
Date of Replacement |
Replaced By - Inclusions |
Replaced By |
||
|
Price on Replacement Date |
Price Next Year |
% Return |
||
|
31-Mar-17 |
Indiabulls Housing Finance |
997.75 |
1243.85 |
24.67% |
|
Indian Oil Corporation |
129 |
113.65 |
-11.90% |
|
|
26-May-17 |
Vedanta |
242.65 |
253.65 |
4.53% |
|
29-Sep-17 |
Bajaj Finance |
1838.05 |
2208.5 |
20.15% |
|
Hindustan Petroleum |
426.8 |
243.15 |
-43.03% |
|
|
UPL |
519 |
443 |
-14.64% |
|
|
02-Apr-18 |
Bajaj Finserv |
526.75 |
727.95 |
38.20% |
|
Grasim Industries |
1089.25 |
845.5 |
-22.38% |
|
|
Titan Company |
944.1 |
1111.9 |
17.77% |
|
|
28-Sep-18 |
JSW Steel |
381.65 |
232.5 |
-39.08% |
|
29-Mar-19 |
Britannia Industries |
3085.5 |
2473.5 |
-19.83% |
|
27-Sep-19 |
Nestlé India |
13740.9 |
15719.8 |
14.40% |
|
19-Mar-20 |
Shree Cement |
17731.45 |
26936.7 |
51.91% |
|
31-Jul-20 |
HDFC Life |
627.1 |
664.05 |
5.89% |
|
25-Sep-20 |
SBI Life Insurance Company |
797.05 |
1222.8 |
53.42% |
|
Divi’s Laboratories |
3061.45 |
4948 |
61.62% |
|
|
31-Mar-21 |
Tata Consumer Products |
638.9 |
777.4 |
21.68% |
|
31-Mar-22 |
Apollo Hospitals |
4516.2 |
4310 |
-4.57% |
|
30-Sep-22 |
Adani Enterprises |
3455.7 |
2387.9 |
-30.90% |
|
13-Jul-23 |
HDFC Ltd |
2,853.80 |
* |
* |
|
07-Sep-23 |
* |
* |
* |
* |
|
30-Sep-23 |
Divi's Laboratories |
3,470.90 |
3,765.80 |
8.50% |
|
LTIMindtree |
5,174.00 |
5,810.60 |
12.30% |
|
|
28-Mar-24 |
Shriram Finance Ltd |
2,238.15 |
2550 |
13.93% |
|
30-Sep-24 |
Bharat Electronics Ltd. (BEL) |
284.40 |
* |
* |
|
Trent Ltd |
4740.95 |
* |
* |
|
|
28-Mar-25 |
Jio Financial Services Ltd.? |
227.51 |
* |
* |
|
Zomato Ltd |
201.20 |
* |
* |
|
Nifty 50
|
Rebalanced Date |
Nifty 50 Index |
||
|
Nifty 50 on Date of Replacement |
Nifty 50 on Selling Date |
Return % |
|
|
31-Mar-17 |
9,173.75 |
10113.70 |
10.25% |
|
9,173.75 |
10,113.70 |
10.53% |
|
|
26-May-17 |
9,595.10 |
10,605.15 |
10.53% |
|
29-Sep-17 |
9,788.60 |
10,930.45 |
11.67% |
|
9,788.60 |
10,930.45 |
11.67% |
|
|
9,788.60 |
10,930.45 |
11.67% |
|
|
02-Apr-18 |
10,211.80 |
11,713.20 |
14.70% |
|
10,211.80 |
11,713.20 |
14.70% |
|
|
10,211.80 |
11,713.20 |
14.70% |
|
|
28-Sep-18 |
10,930.45 |
11,512.40 |
5.32% |
|
29-Mar-19 |
11,623.90 |
8,660.25 |
-25.50% |
|
27-Sep-19 |
11,512.40 |
11,050.25 |
-4.01% |
|
19-Mar-20 |
8,263.45 |
14,744.00 |
78.42% |
|
31-Jul-20 |
11139.5 |
15763.1 |
41.51% |
|
25-Sep-20 |
10910.4 |
17853.2 |
63.63% |
|
10910.4 |
17853.2 |
63.63% |
|
|
31-Mar-21 |
14811.9 |
17464.8 |
17.91% |
|
31-Mar-22 |
14811.9 |
17464.8 |
17.91% |
|
30-Sep-22 |
16798.1 |
19638.3 |
16.91% |
|
13-Jul-23 |
19,413.75 |
24,050.65 |
23.88% |
|
07-Sep-23 |
19,545.75 |
22,091.60 |
13.03% |
|
30-Sep-23 |
19,638.30 |
22,535.40 |
14.75% |
|
19,638.30 |
22,535.40 |
14.75% |
|
|
28-Mar-24 |
22,326.90 |
24,100.00 |
7.94% |
|
30-Sep-24 |
25,810.85 |
* |
|
|
25,810.85 |
* |
|
|
|
28-Mar-25 |
23,519.35 |
* |
|
|
23,519.35 |
* |
|
|
The Replacement Premium: Do New Entrants Outperform?
Historical data of Nifty 50 Index rebalancing shows a definite trend. Nearly around 65% of the Nifty 50 inclusion stocks have performed better than its replaced stocks in the replacement year. Average return difference is 17.2%. (On average, included stocks gave a return of 12%. Whereas the excluded stocks gave a return of -5.2%) This study shows considerable "replacement premium" for new index members.
Consider these notable examples:
•When Indiabulls Housing Finance substituted BHEL in March 2017, it generated a 24.67% return in the subsequent year, whereas BHEL would have lost 24.04% in the same period. So the replacement differential premium paid in this substitution is 24.67% - (-24.04%) = 48.71%
• Likewise, The substitution of Yes Bank by Shree Cement in March 2020 caused a gain of 51.91% whereas Yes Bank would have lost 72.06%. Therefore, the replacement differential premium incurring in this substitution is 123.97%
• Likewise, the addition of Bajaj Finance in place of ACC during September 2017 resulted in a 25.18% differential (20.15% profit over 5.03% loss).
But not all substitutions in Nifty 50 rebalancing generate value. When JSW Steel replaced Lupin in September 2018, it then fell 39.08%, far underperforming Lupin (-20.39%).
Sector Rotation: Following the Money
A distinct sector replacement trend can be seen in each rebalancing that mirrors the shifting economic conditions.
1. Financial Services Growth: The major addition of financial shares (Bajaj Finance, Bajaj Finserv, HDFC Life, SBI Life, Jio Financial Services) reflects the increasing relevance of this sector to India's economy.
2. Industrial/Energy Contraction: Old industrial and energy firms such as BHEL, Tata Power, Indian Oil Corporation, and BPCL have been slowly phased out from the index.
3.Consumer Industry Growth: The inclusion of consumer-oriented businesses (Trent, Titan, Nestle, Tata Consumer Products) highlights India's consumption-led growth narrative.
4. Technology and Healthcare Growth: The deletion of some of the pharmaceutical firms and addition of others (such as Divi's Laboratories) along with technology services companies reflects selective growth in these industries.
Investment Implications: Strategies Based on Index Changes
For investors wishing to take advantage of index replacement trends, some possible strategies arise:
1. Anticipatory Positioning: Shares that are likely to find a place in the Nifty 50 tend to appreciate in price prior to the announcement. Selecting likely candidates on the basis of market cap, industry representation, and financials could provide opportunities.
2. Post-Replacement Momentum: The statistics indicate that successful replacement stocks tend to continue their upward path for 12+ months subsequent to inclusion, which indicates that a momentum-based strategy can work.
3.Sector Allocation Signals: Sector rotation decisions by the index committee are indicative of institutional views on economic trends. Investors may look to overweight sectors that are increasing representation in the index.
4. Contrarian Opportunities: A few removed stocks witness heavy overselling, resulting in value opportunity plays for longer-time horizon contrarian investors.
The Recent Picture (2023-2025)
Recent replacements indicate the continuation of settled trends:
• Addition of consumer-oriented Trent Ltd. (which added 42.89% after inclusion)
• Growth in the manufacturing of electronics through Bharat Electronics Ltd.
• The rise of new-age firms with Zomato's addition in 2025
The theme of financial services continues with Shriram Finance and Jio Financial Services entering the index, indicating the sector's continued significance in India's economic scenario.
Comparative Analysis of Trending Stocks in 2025
Insights observed on the following trending stocks
Return Analysis
|
Return Analysis |
10-year CAGR |
5-year return |
3-year CAGR |
1-year CAGR |
|
Trent Limited |
21% |
55% |
59% |
42% |
|
Bharat Electronics Limited |
23% |
64% |
52% |
26% |
|
Zomato Limited |
0 |
0% |
37% |
12% |
|
Shriram Finance Limited |
11% |
37% |
39% |
25% |
|
Jio Financial Services |
0% |
0% |
0 |
-39% |
Based on the price return performance of the trending. Following observations are seen.
• Bharat Electronics Limited takes the top with the highest 10-year CAGR (23%) and 5-year return (64%), reflecting steady long-term progress.
• Trent Limited reflects strong performance with the highest 3-year CAGR (59%) and 1-year CAGR (42%), though it witnessed temporary volatility upon Nifty 50 inclusion (-7%, -9%).
•Zomato Limited, being a fairly newer listed company, has no 10-year or 5-year figures but exhibits good 3-year growth (37%). It was added to the Nifty 50 index recently.
•Jio Financial Services is the sole company that has negative returns (-39%) in the last year, reflecting recent struggles even though it was added to the Nifty 50 index
• For high CAGR investors, Bharat Electronics and Trent Limited would-be good prospects based on their stable performance in various time periods
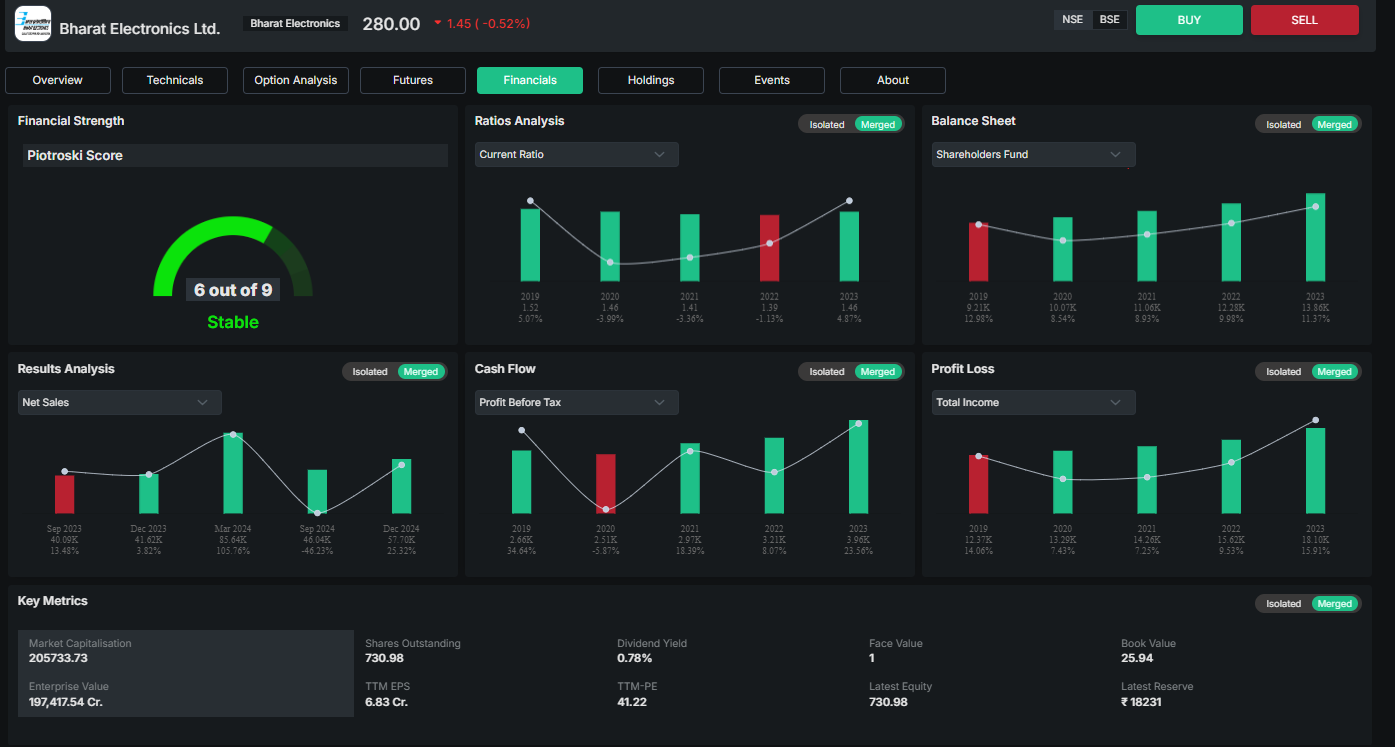
Financial Analysis
|
Financial Analysis |
Dividend Yield |
Market Capitalization in INR crores |
TTM EPS in INR crores |
TTM PE |
ROE |
|
Trent Limited |
0.07% |
169324.01 |
53.14 |
89.63 |
19.12 |
|
Bharat Electronics Limited |
0.78% |
205733.73 |
6.8 |
41.42 |
23.52 |
|
Zomato Limited |
0.00% |
207723.8 |
1.85 |
116.63 |
0.67 |
|
Shriram Finance Limited |
1.40% |
120871.07 |
50.88 |
12.63 |
15.7 |
|
Jio Financial Services |
0.00% |
142821.83 |
0.83 |
269.71 |
1.82 |
On the basis of the examination of the in-vogue shares on its accounting. Following observation is seen.
•Trent Limited with a piotroski value of 8,has a regular dividend payment record, reflecting healthy financial health. With a 0.07% dividend yield, it pays low returns for investors.

•Despite Shriram Finance Limited having a weak piotroski value of 2,it has yielded a maximum dividend value of 1.40%.
•Currently, Zomato and Jio Financial Services do not pay any dividends (0.00% yield).
•On the valuation front, Shriram Finance has the lowest P/E ratio (12.63), while Jio Financial Services has the highest (269.71).
•Bharat Electronics has the highest Return on Equity (ROE) at 23.52%, which implies effective utilization of equity capital.
•Zomato has the lowest ROE (0.67%), which implies difficulties in generating profit from shareholder equity.
Technical Analysis
Bharat Electronics Limited (BEL)
Best Technical Balance: Reveals bullish trends on longer-term charts (75% bullish EMA/SMA) but more optimistic crossover situation (67% bullish) compared to other five stocks examined
Current Situation: Sandwiched between bullish long-term trend and bearish short-term signals
Chief Strengths: Bullish mid-term and long-term moving averages crossovers, highest among the five stocks' RSI (44.38)
Chief Weaknesses: Bearish short-term crossover and ROC indicator
Overall Assessment: Demonstrating comparative technical strength to peers with scope for trend extension if short-term setback is overcome
JIO Financial Services Limited

Contradictory Signals: Highly bullish EMA/SMA signals (83%) but bearish technical indicator (43%) and moving average crossover (67%) readings
Mixed Mid-Term Picture: Indicates bullish 20-day and 50-day crossover in the face of bearish short- and long-term signals
Technical Concern: Bearish MACD and ADX readings indicative of momentum loss
Positive Note: Bullish signals on CCI, Williams %R, and Ultimate Oscillator offer some balancing
Overall Finding: Technical configuration reflecting major tension in spite of some encouraging oscillator readings
Extreme Divergence: Extreme contrast between 100% bullish EMA/SMA signals and 100% bearish moving average crossovers
Potential Reversal: Such extreme divergence tends to happen before important price action
Positive Sign: Bullish MACD is one of the very few positive technical signals
Risk Factors: All moving average crossovers (short/mid/long-term) displaying bearish signs
Overall Assessment: Technical setup indicates a stock at a make-or-break situation where long-term strength is under serious threat from recent weakness
Retail Sector Weakness: Bullish EMA/SMA readings (83%) opposed by bearish technical indicators (43%) and moving average crossovers (67%)
Potential Exhaustion: Lowest RSI of the five stocks (35.21) indicates potential downward momentum
Mixed Signals: Bullish long-term moving average crossover in the face of bearish short and mid-term signals
Oscillator Strength: Bullish CCI, Williams %R, and Ultimate Oscillator readings offer some relief
Overall Assessment: Technical chart indicates a stock that had a good run but now is heavily indicating trend exhaustion

Most Extreme Contradiction: 100% bullish EMA/SMA indications against 83% bearish moving average crossovers
Notable Gap: 200-day SMA (215.28) well above shorter-term SMAs, reflecting recent steep correction of a strong prior uptrend
Uniform Weakness: Bearish readings in most timeframes and technical studies
Possible Support: Bullish Ultimate Oscillator and Williams %R offer limited technical support
General Assessment: Technical setup reflecting most serious weakening of the five stocks examined, with short-term weakness actively challenging the long-term bullish trend
Key Insights:
BEL is the strongest technically with balanced strength.
Shriram Finance and JIO show bullish tendencies but face resistance from crossovers.
Trent and Zomato are technically weak short-term but may offer long-term potential
Indicator Analysis
RSI Indicators
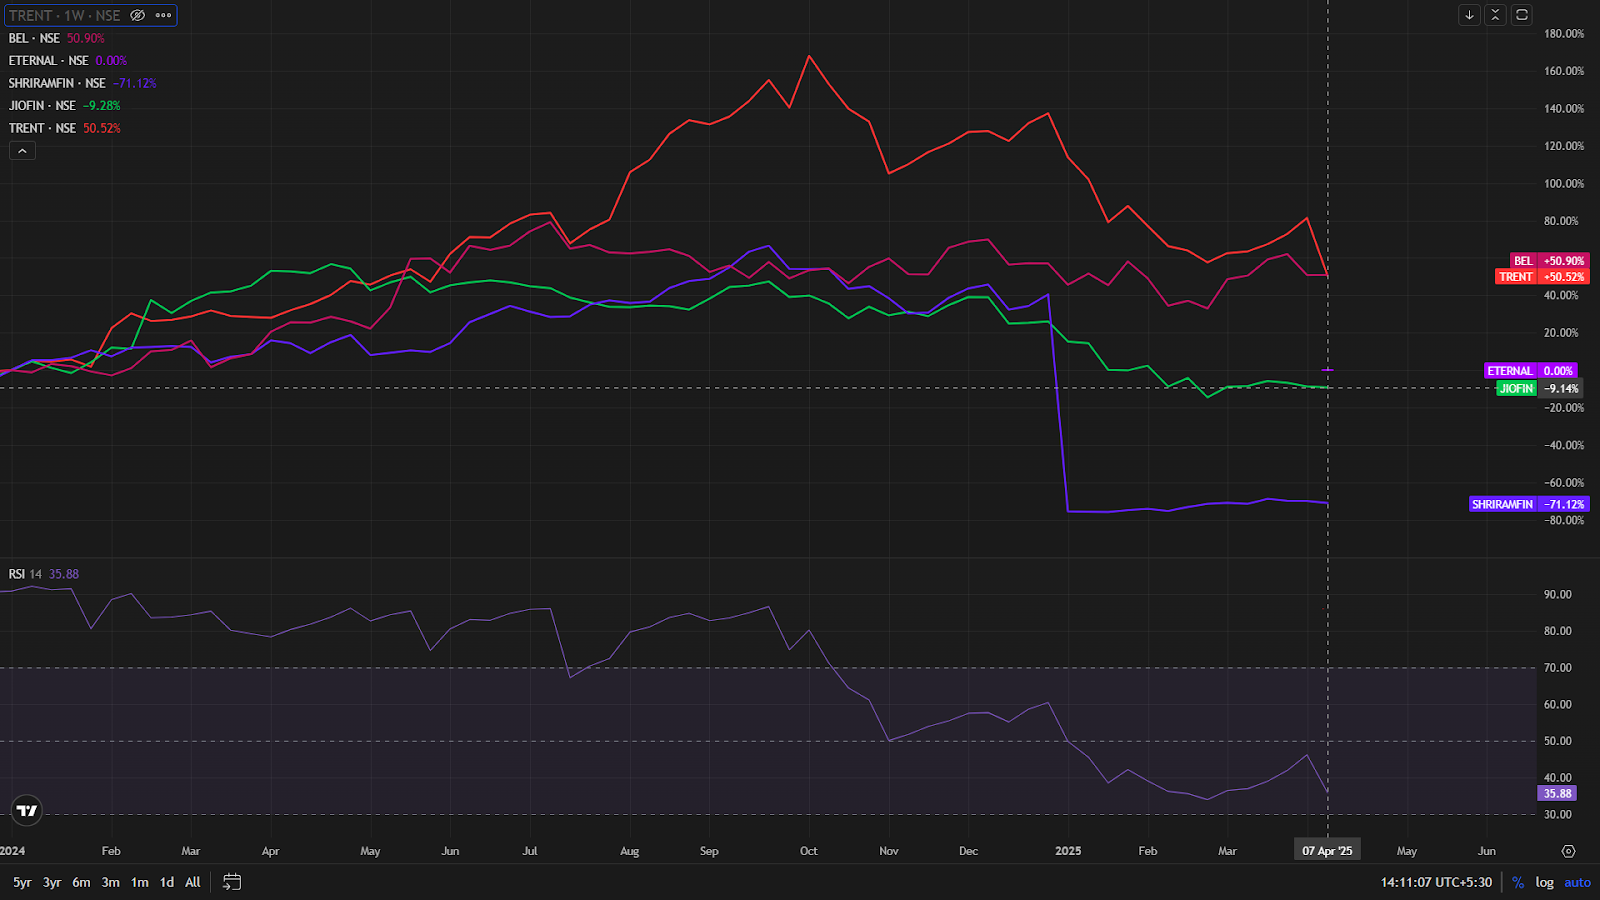
MA Crossovers Indicators
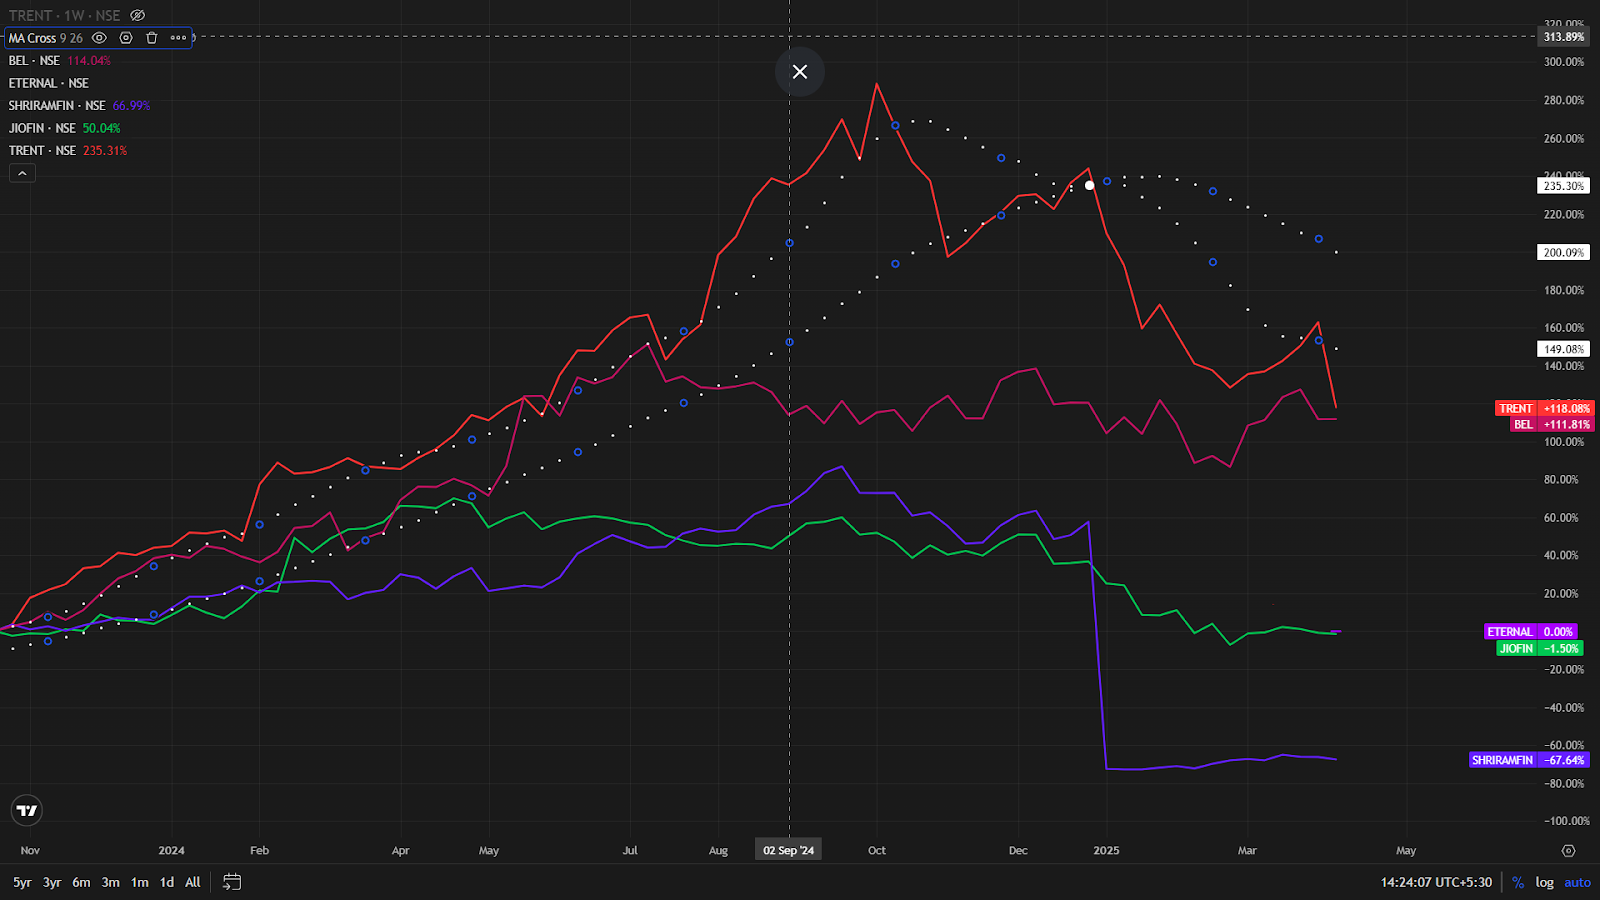
The above chart exhibits the comparative analysis of five trending stocks based on Moving average crossover signals and Relative strength index .
Conclusion: Beyond the Replacement Effect
While the "replacement effect" provides interesting insights, investors should exercise caution. External market factors significantly influence performance beyond simple index inclusion dynamics. Additionally, the dataset lacks fundamental metrics that would provide deeper insights into valuation changes pre- and post-replacement.
Nevertheless, tracking Nifty 50 replacements offers a unique window into evolving market dynamics and sector rotation trends that can enhance investment decision-making. The historical patterns suggest that index changes aren't merely administrative adjustments but potential signposts for market direction and sector leadership in India's rapidly evolving equity landscape.
Frequently Asked Questions
What is the Nifty 50 replacement effect?
It is the differential performance between those added to and dropped from the Nifty 50 index upon rebalancing.
Do newly added Nifty 50 stocks perform better?
Yes, roughly 65% of inclusions over exclusions have historically returned on average by 17.2%.
What motivates Nifty 50 index rebalancing?
Changes to the index are motivated by performance, market capitalization, and sector representation changes.
Which sectors benefited from Nifty 50 changes?
Financial and consumer segments witnessed greater inclusion, mirroring changing economic patterns.
Are investors able to profit from index rebalancing patterns?
Yes, by examining replacement premiums as well as industry trends, strategic investment guidance can be derived.
Disclaimer: This blog is dedicated exclusively for educational purposes. Please note that the securities and investments mentioned here are provided for informative purposes only and should not be construed as recommendations. Kindly ensure thorough research prior to making any investment decisions. Participation in the securities market carries inherent risks, and it's important to carefully review all associated documents before committing to investments. Please be aware that the attainment of investment objectives is not guaranteed. It's important to note that the past performance of securities and instruments does not reliably predict future performance.
