Crude Oil
Monday 28 April, 2025
Short term - Technical Outlook
Crude Oil is currently trading within an ascending channel. In the last session, it closed at 5,396, up by 16 points. As long as it stays within this pattern, a move toward the upside is expected in the coming days. Further momentum is likely above 5,452. However, a breakdown below 5,275 could trigger downside pressure. A confirmed breakdown below 5,270 would invalidate the bullish structure and suggest further weakness.
Short term Research Report Call
Buy Above: 5,450 | Targets: 5,500, 5,551, 5,640 | Stop-loss: 5,400
Sell Below: 5,275 | Targets: 5,230, 5,190, 5,120 | Stop-loss: 5,310
Short term Chart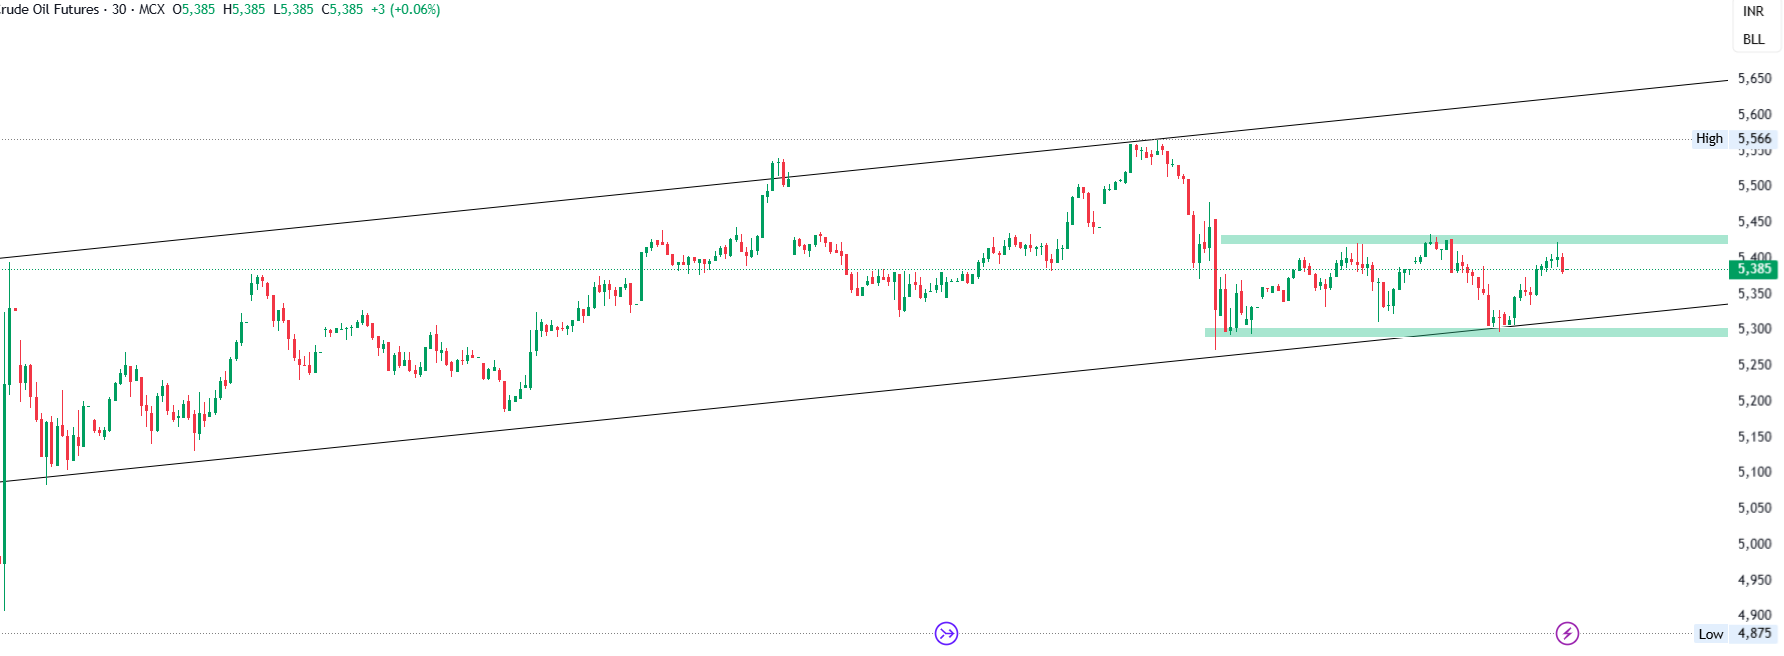
Validity
19/05/2025
Pivot
5375.33
Buy Above
5397.09
R1
5427.01
R2
5458.29
R3
5514.05
Stop Loss
5388.93
Pivot
5375.33
(All values are in INR)
Sell Below
5353.57
S1
5323.65
S2
5292.37
S3
5236.61
Stop Loss
5388.93
Gold
Monday 28 April, 2025
Short term - Technical Outlook
Gold is currently trading in a descending channel in the 15-minute chart. In the last session, it closed at 94,992, down by 920 points. A breakout on either side is needed to confirm momentum. However, holding above the 94,000 mark could be supportive for Gold in the short term. For intraday traders, a move above 95,400 may indicate upside potential, while a dip below 94,600 could trigger further downside.
Short term Research Report Call
Buy Above: 95,400 | Targets: 95,730, 96,170, 96,320 | Stop-loss: 95,000
Sell Below: 94,600 | Targets: 94,300, 93,850, 93,400 | Stop-loss: 94,900
Short term Chart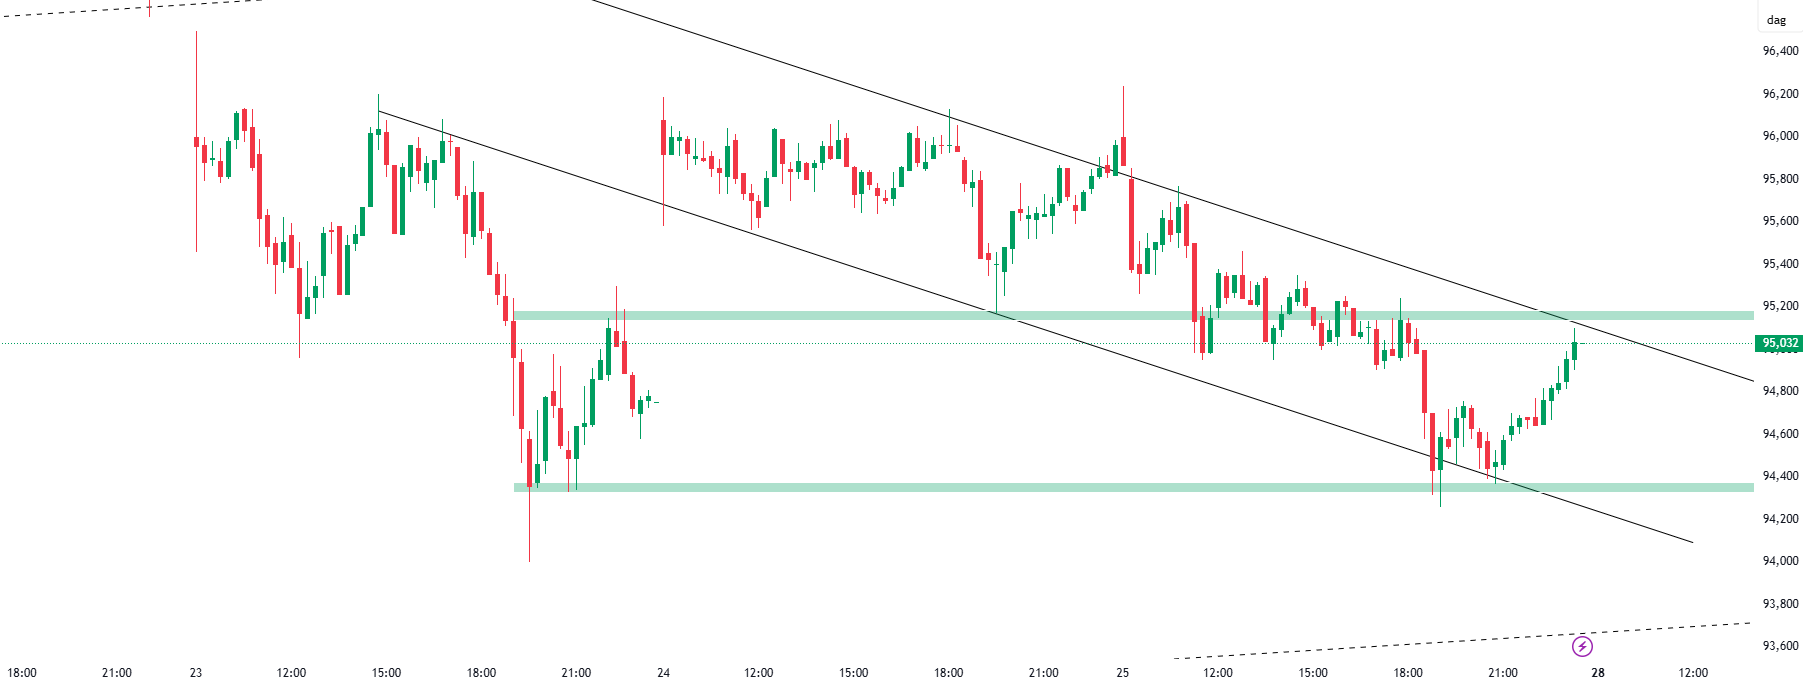
Validity
05/06/2025
Pivot
95162.33
Buy Above
95479.61
R1
95915.87
R2
96371.96
R3
97184.99
Stop Loss
95360.63
Pivot
95162.33
(All values are in INR)
Sell Below
94845.05
S1
94408.79
S2
93952.70
S3
93139.67
Stop Loss
95360.63
Natural Gas
Monday 28 April, 2025
Short term - Technical Outlook
Natural Gas is trading in a descending channel on the 15-minute chart and is currently at 250.8. In the last session, it closed at 250.8, up by 1.8 points. Technically, Natural Gas has been trading in a negative trend for the last few days. However, if it sustains above 275, further positive momentum could unfold in the short term. An intraday move is likely above 256 and downside below 245.
Short term Research Report Call
Buy Above: 256 | Targets: 262, 264, 275 | Stop-loss: 253
Sell Below: 245 | Targets: 243, 237, 234 | Stop-loss: 248
Short term Chart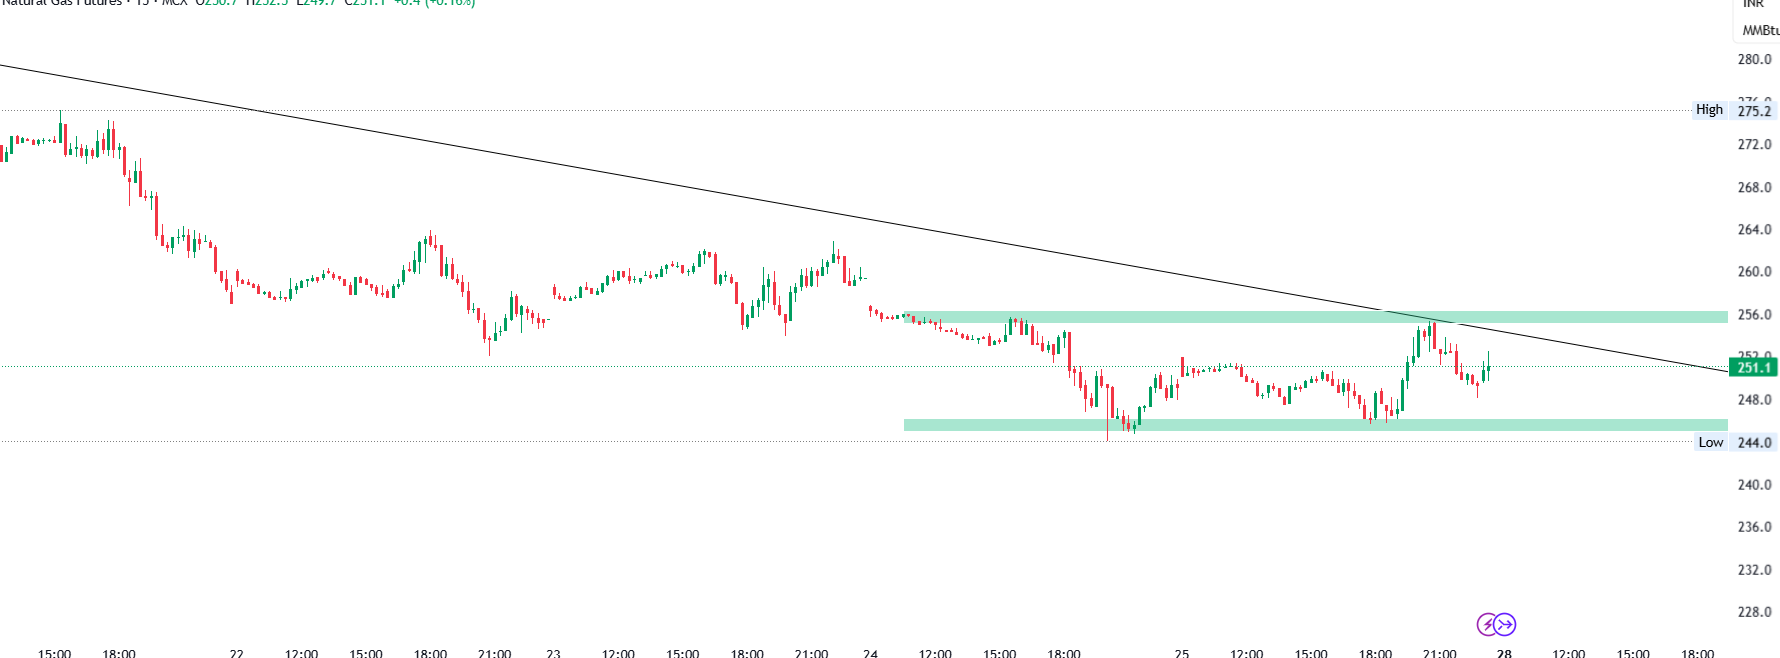
Validity
25/04/2025
Pivot
250.73
Buy Above
252.29
R1
254.42
R2
256.65
R3
260.63
Stop Loss
251.70
Pivot
250.73
(All values are in INR)
Sell Below
249.18
S1
247.05
S2
244.82
S3
240.84
Stop Loss
251.70
Note: Above information is not recommending any buy or sell position, this is for your reference only and trading or investment in commodities & derivatives is subject to market risk.
Disclaimer: Investment in securities/commodities market subject to market risk, read all the related documents carefully before investing/trading.
Analyst Certification: I/We, Ayushi Jain Research Analyst, authors, and the name subscribed to this report, hereby certify that all the views expressed in this research report accurately reflect our views about the subject issuer(s) or securities. We also certify that no part of our compensation was, is, or will be directly or indirectly related to the specific recommendation(s) or view(s) in this report. NISM Research Analyst registration number – NISM-201900015194.
